Multi Graph Definition

Contents
A Multi Graph Definition contains graphs, added by the user, using data from various tables in Ple4Win. It is possible to create, copy, rename and even delete Multi Graph Definitions. Modifying individual graph data within a definition is also allowed (update, change or group the graphs) prior to showing them. This process can be done in the Multi Graph Definition panel. This panel is also used to select the graphs to be shown in the (next) Multi Graph Drawing panel.
There are 2 different ways to activate this panel:
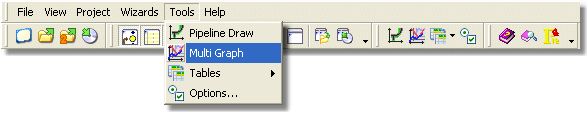
➢ Select from menu Tools > ![]() Multi Graph
Multi Graph
or,
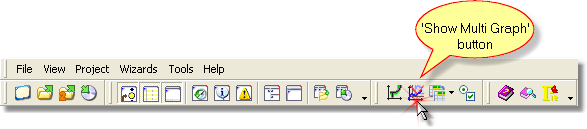
➢ Click on the 'Show Multi Graph' ![]() button on the main toolbar
button on the main toolbar
The Multi Graph Definition panel will appear in the place of the Overview panel.

To switch between the Multi Graph Definitions, either select the desired one from the drop-down box, or type the name of the definition directly into the drop-down box and click on Enter. The selected definition will be used when adding Multi Graph data.
The graph of the selected definition can be shown or cleared using the controls on the right side of the panel. Definition data can even be replaced with definition data from secondary database. Depending on the graph data, different actions are possible:
|
It is possible to create a new definition or to rename, copy and delete an existing definition by using the buttons in the Multi Graph Definition box. ➢To create a new definition: click on ➢To rename or copy an existing definition: select the to be renamed definition, click on ➢To delete a definition: select the definition and click the
|

Removing or duplicating graph can be done using the buttons on the right side of 'Curves Data' table.
|

The layout of each graph can be changed in the 'Curves Setup' table.
Labels for each graphs x- or y-axis can be added in the 'X-axis title' and 'Y-axis title' columns. The data ranges X(min) to X(max) and Y(min) to Y(max) to be shown can be changed individually for each graph. Using Y(reference), a reference value can be given to create a reference line for each graph. The reference line will be drawn for both the positive and negative absolute values. The colour and line style of each graph can also be changed individually. |

X-axes or Y-axes of different graphs can be linked, i.e. one axis is to be used for two or more graphs. The axis that will be shown in the Multi Graph, can be found in the Link to(..) columns by its ID number. If graphs are linked, data of the axis where the Link to(..) column is filled, will not be used in the Multi Graph.
|


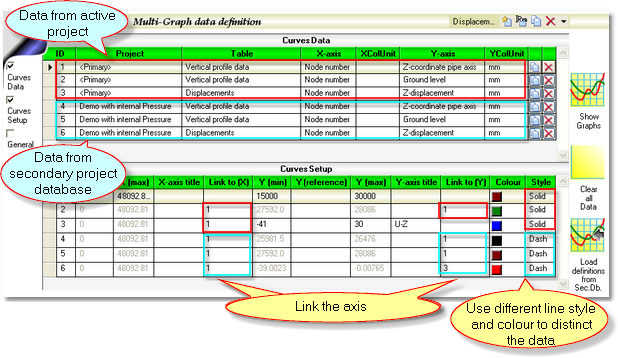
To compare data from the primary database with data from the secondary database: 1.You need to add these data from both databases to a Multi Graph Definition (how to do this, please see topic Multi Graph). In the example below, the displacements of a 8" pipeline with and without internal pressure (40 bar) are being compared.
As seen in the screenshot above, information about the origin of the data can be found in column Project. Data in the first 3 rows come from the primary database (current project: pipeline without internal pressure) and the last 3 rows are from the secondary database (pressurised pipeline). Please note, that even though the first 2 rows data from the secondary database are actually unnecessary ('Z-coordinate pipe axis' and 'Ground level' from table 'Vertical profile data'), this is a nice way to check whether the pipe configuration data are correct. 2.Make sure you link both X as well as Y axes to the correct graph. In this case, the X axes of each graph is linked to Vertical profile data from the primary database. Link also the Y axes of each graph to Vertical profile data except for the Displacements. The Y axes of Displacements from both databases are linked to each other. 3.When finished, click on Show graph button to view the result.
The topmost lines are the Ground level lines (solid green line from the primary database and dash brown line from the secondary database). These lines cover each other which means that the ground level of both projects are located on the same position. The lines in the middle of the graph are the Z-coordinate pipe axis lines (solid brown line from the primary database and dash black line from the secondary database). Also these lines cover each other. This means that the pipe configuration of both databases is the same (in the Z direction). For this particular situation, the same conclusion can be made for the Displacements line (solid blue and dash red lines on the bottom of the graph). An internal pressure of 40 bar affects hardly in this case. Below, more examples of data comparison can be found below for this particular 8" pipe situation.
|


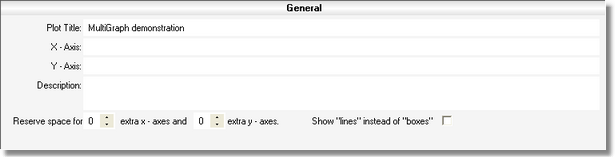
Setting or changing the general options of the drawing to be shown in the multi graph drawing panel can be done in General table. Make sure that the checkbox General on the left side is checked. General labels and a description of the multi graph drawing can be added here.
Certain types of graphs (graphs of tables where only a limited selection of the nodes or elements are given) normally are drawn with vertical lines at the node/element position. By setting the checkbox Show "lines" instead of "boxes" those graphs are also drawn as conventional lines without the vertical parts. Additional space can be added to the left and below the drawing by changing the Reserve space values.
|
MultiOver, last changed: 14/09/2016
See also: