Overview Panel

Contents
The overview panel is mainly used to show a list of all data tables belonging to a specific design function.

The significance and status of each table, its occurrence and last change-timestamp are also shown.

Tables are grouped into input-, output-, additional output-tables (only if available) and wizard data tables (only if available).
![]() The overview panel is also used to display the multi graph overview.
The overview panel is also used to display the multi graph overview.
Table lists
All tables belonging to the indicated design function are shown, grouped by their type (input, output or additional output). Individual tables can be opened in the workspace panel by double-clicking the table row.

Multiple tables can be selected by single-clicking their rows (in combination with the Shift or Ctrl key) and then clicking the corresponding lists Show button.
![]() Depending on settings of the program options the number of columns shown in the lists may vary.
Depending on settings of the program options the number of columns shown in the lists may vary.
![]() If a column header is clicked, the list of tables will be sorted depending on the values of that column. Clicking again will reverse the sort order.
If a column header is clicked, the list of tables will be sorted depending on the values of that column. Clicking again will reverse the sort order.
![]() Unavailable tables are greyed out and cannot be opened.
Unavailable tables are greyed out and cannot be opened.
![]() Empty output and additional output-tables cannot be opened, unless a secondary database is defined. In that case the empty table can be used to define graphs with data from that secondary database. See the multi graph overview for more information.
Empty output and additional output-tables cannot be opened, unless a secondary database is defined. In that case the empty table can be used to define graphs with data from that secondary database. See the multi graph overview for more information.
Individual groups of tables can be shown or hidden by (un)checking the corresponding checkbox at the left side of the panel.
![]() Additional output-tables are only available in design functions 5 ("Pipeline Behaviour") and 6.2 ("Cross-Section Behaviour").
Additional output-tables are only available in design functions 5 ("Pipeline Behaviour") and 6.2 ("Cross-Section Behaviour").
![]() Some design functions may have a group of Wizard Data Tables. Since version 4.1.0 design function 3.2 is compatible with a specialised Soil Model Wizard.
Some design functions may have a group of Wizard Data Tables. Since version 4.1.0 design function 3.2 is compatible with a specialised Soil Model Wizard.
One of the most important columns of all table lists is the Status-column. It summarizes the state the table is currently in. The state of all tables of a design function in turn determines the overall state of that design function, shown in the roadmap.

The following status are possible:
|
This table does not contain any data, it can be opened to add data. |
|
This table does not contain any data, however, a calculation attempt failed because data in this table is needed. |
|
This table does not contain any data, it cannot be opened (unless a secondary database is defined, see above). |
|
This table does not contain any data because the user selected a model option instructing the program to ignore the input data present this table is based on. It cannot be opened (unless a secondary database is defined, see above). |
|
This table does contain data, however, that data has not yet been fully checked (tested). The table can be opened to add, modify and/or check the data. |
|
This table does contain data, however, a calculation attempt failed because this data has not been tested. The data in this table can be edited. |
|
This table does contain data, however, during testing or during the calculation it was determined that the data has errors. Alternatively, the data is technically correct, but the program warns that it will most likely lead to unrealistic results. See the warning table for more information. This table is editable. |
|
This table does contain data that has passed all pre-calculation tests. Data in this table can be edited, however, its status will be changed to 'Data' in that case.
|
|
This table does contain data, it can only be read. |
|
This table does contain data, it can only be read. At least one value of that table data exceeded a given limitation. See the warning table for more information. |
|
This table does contain data after a design function has been set back or unlocked (see below). It can be edited. |
|
This table does contain data after a design function has been set back or unlocked (see below). At least one value of that table data exceeded a given limitation. See the warning table for more information. |
|
The status of this table could not be determined. If you encounter a table with this status, please contact your reseller or the program manufacturer. |
Design function control
Controlling the design function is done through the icons and texts on the right side of the panel.
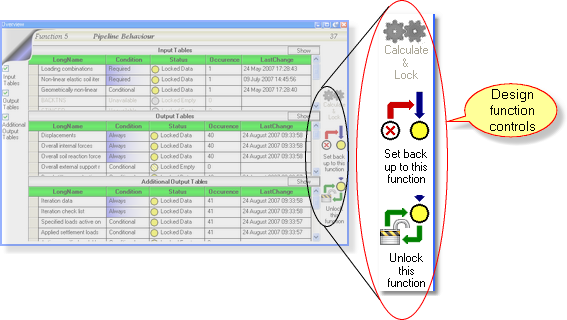
Depending on the design function and its processing state, different actions are possible:
Process this design function. If the design function before it can be processed automatically, that will be processed as well. The icon is animated while calculations are in progress. It is disabled / greyed out after successful processing. After successful processing all data tables are locked, their data cannot be modified any more. |
|
|
Only visible while processing a design function. If clicked, a small window will appear to give the user the choice between stopping (output data of last iteration is retained, may not end processing immediately), aborting (output data is lost, ends processing instantly) or cancelling this action (continue processing). |
|
Normally disabled / greyed out until the design function has been processed successfully. Clicking it will clear all output data and unlock all data tables, making changes to their data possible again.
|
|
Only available in design functions 5 ("Pipeline Behaviour") and 6.2 ("Cross-Section Behaviour"). Disabled / greyed out until the design function has been processed successfully. Clicking it will leave the output data intact and unlock all input tables, making changes to their data possible again.
|


Overview, last changed: 14/09/2016
See also: