
Ple4Win 4.8.1 released
We are happy to announce the release of Ple4Win version 4.8.1. This version is a service release, focusing on enhancements, stability improvements and bug fixes. However, a couple of new functionalities have also been added. For a detailed description of all that is new and changed, please see the change log. As always, we advise customers to upgrade to the latest version, even if no issues have been encountered using version 4.8.0. Click here to download Ple4Win Professional 4.8.1 right away. The highlights of this new release are:
- Data comparison between the primary and secondary databases added.
- 3D visualisation updates such as: wave shape, nodal loads, ribbons for ground and water levels.
- Clarifications and additions to the help file.
- Numerous small improvements throughout the whole program.
- Quite a lot of bugs have been fixed.
Data comparison between the primary and secondary database
With this update it has been made possible to compare the data from the primary and secondary databases in and of the same table. This is possible for both input and output tables. An example:
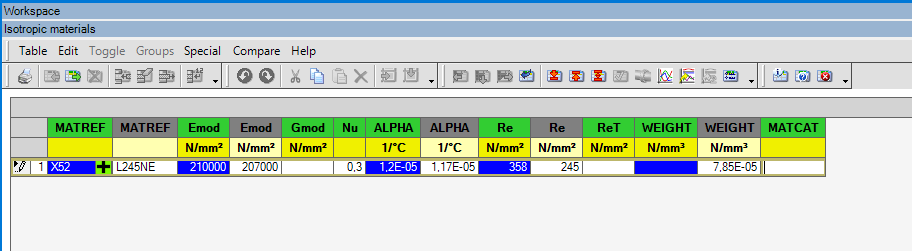
The grey headers indicate the columns of the secondary database. Not all of them are shown in the default view, only the ones who actually contain differences. This is shown by the blue highlighting of the cells themselves.
This functionality can be accessed under the “Special” menu item of the table toolbar. When comparing data, the “Compare” menu is added giving options to alter the way the differences are presented.
For exporting comparison results of multiple tables, a separate tool is available. This option can be found in the program’s main toolbar, next to the other import/export possibilities.
The functionality is described in full detail in the help file.
3D visualisation updates
The 3D visualisation has gotten numerous updates, both on the backend to make it run more smoothly, and on the frontend to improve clarity and functionality. Some changes were made so the user interface matched more between the pipe visualisation and the soil wizard. Following are a couple of examples which were made to the 3D visualisation.
Wave-form and ribbons
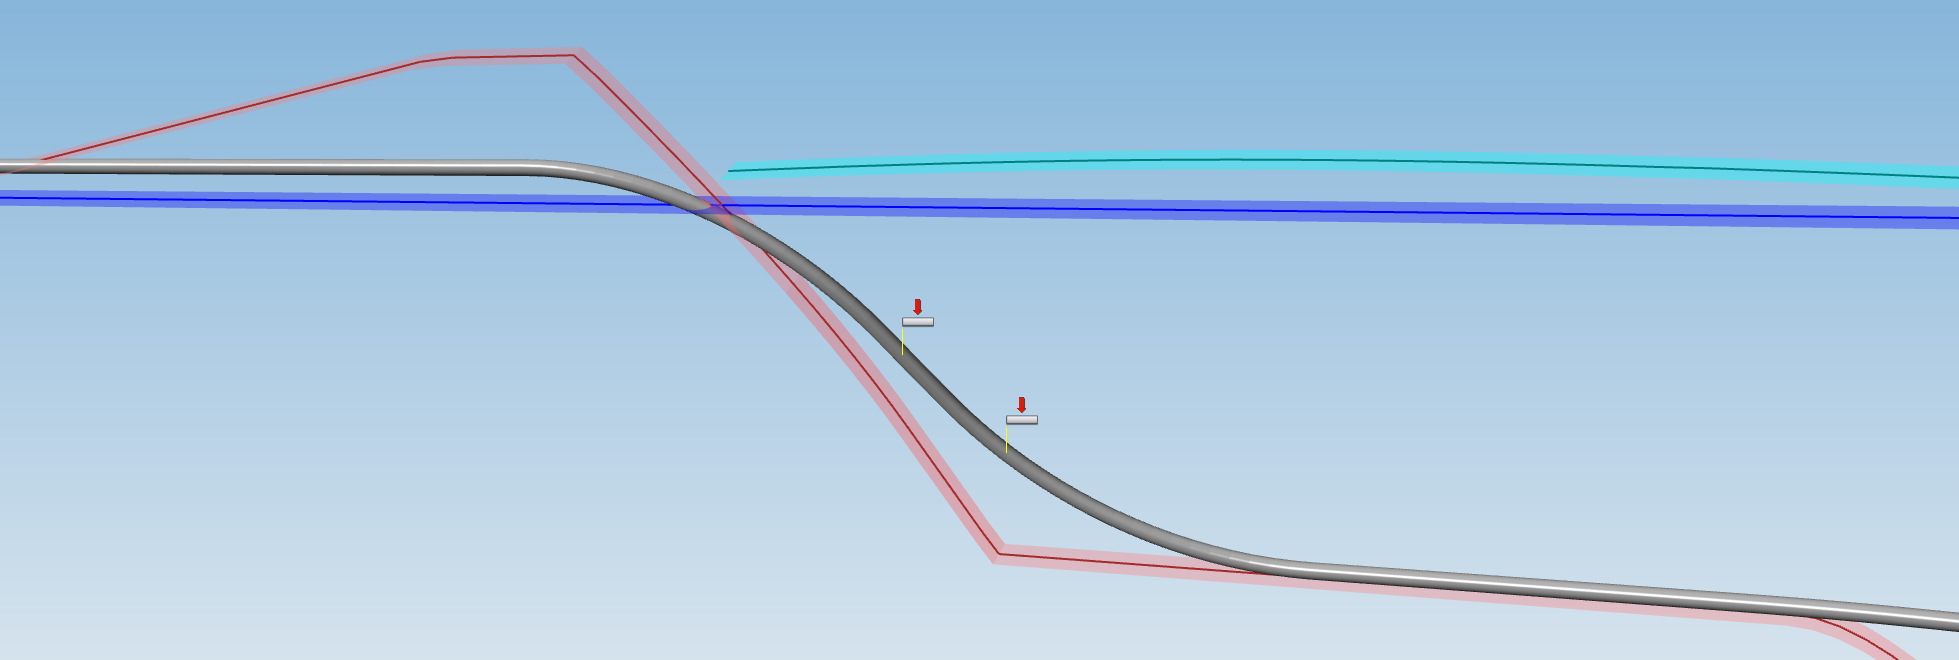
To improve the visibility of the ground and water levels it has been made possible to display them not as just lines but also as ribbons. This feature has also been added to the now displayable wave levels as shown in the image below:
 Nodal loads
Added to the list of visible constraints are now nodal loads. These are indicated by an icon with a red arrow on top of a pipe, as shown above.
Negative values in histogram
This update also enables the user to start the histogram from a negative value, instead of only allowing positive values as starting point.
Other program changes
A lot of existing functionality has been updated, streamlined or improved. Please see the change logs for all details. Some of the more noticeable changes are:
- Improved the soil wizard handling of step changes in data, such as ground/water level or diameter (this may result in a change of generated idents).
- Performance improvement when (re-)drawing large or complex graphs.
- Expanded hotkeys are available when working with tables.
- Pipeline joints helpfile pages have been improved with schematics and better explanation.
- And more…
Licence agreement changes
We have been working on modernising our software licence agreement. Starting 1-1-2025, a General Terms and Conditions-document exists that is valid for all customers. The contents of this document are based on our older individual license agreements, but are updated to reflect modern rules and to allow for easy introduction of other licensing types in the future, if required. This new licence agreement will affect all users, existing and new. See the documents page if you want to download the EDS General Terms and Conditions.
Courses for Ple4Win users
As experienced Ple4Win users know, the performance, accuracy, and speed of pipeline projects depend to a large extent on how well the project is modelled. A well-designed pipeline model can often have greater benefits than simply having a faster computer, and can prevent the need for extensive calculations on model variations.
To help users master the art of creating good, functional pipeline models, we are offering a half-day course. This course is designed for experienced users who want to refine their modelling skills and learn advanced techniques.
In addition to our experienced user course, we also offer training for new users as well as customised training for individuals or small groups. This training can be tailored to your specific needs and can address any particular challenges you may be facing.
The combination of a course and assistance with a project to be calculated is also possible. Again, contact us for more information.
Ple4Win forum
For support or advice, please visit the Ple4Win forum. There you can also read the FAQs, tips & tricks, report your findings or tell us your views.